

- Getting Started
- Time Tracking
- Monitoring & Productivity
- Desktop Timer Application
- Work Management
- Time Off & Scheduling
- Administration & Settings
- Integrations
- API
- FAQ
Personal Dashboard
Última actualización:
Personal > Dashboard is every user's own overview: how much time they logged, how active they were at the computer, what they earned, when they usually work and which apps they spent the time in. It shows only the signed-in user's own data. For the whole company, see Company Dashboard.
Choosing the period
Switch between Day, Week and Month and use the arrows to move between periods. The dashboard opens on the day, and your browser remembers the last choice. A week starts on the company's first day of the week, a month on the 1st. Changes are compared with the previous period of the same length.
On Month, the dashboard first shows the month as before: a donut of the month by project with Full timesheet, and the Daily totals and Weekly totals calendar. Each day shows the time logged, its time types, leaves, holidays, a rejected marker, and a warning when it is below the minimum hours; click a day to open it in your timesheet.
Key insights
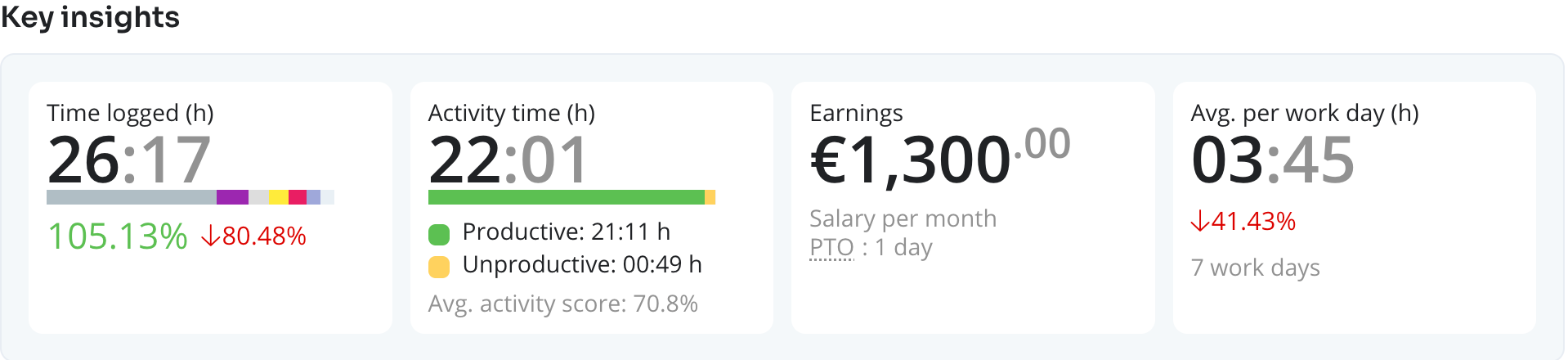
- Time logged (h) — The time that counts for the period, split by project, with the change against the previous period (not shown for a day). Rejected time is left out. When the time logged falls short of your required hours, a warning icon shows the percentage reached; hover it for Actual vs. Required Time. If some of your time is waiting for a manager's approval, a line under the card says how much.
- Activity time (h) — Computer activity recorded by the desktop app while a timer was running, split into Productive and Unproductive (see Productive and Unproductive Time). Avg. activity score is added when the activity score is on for you (see User Activity Score).
- Earnings — What you earned in the period. With an hourly rate, it is your wage plus PTO (pay for approved leave of a paid leave type on your working days, at your hourly wage), with the change against the previous period. With a salary, the card shows your salary, labelled Salary per day, per week or per month, and the number of paid leave days in the period, which the salary already pays for. Hover PTO for the explanation. The card is shown only to users whose role has View own pay rates or View pay rates and wages and who have a pay rate.
- Clock in/out (day) — The start of your first and the end of your last time entry of the day, breaks left out.
- Avg. per work day (h) (week and month) — The time logged divided by the number of days you logged time on, with the number of work days and the change against the previous period.
Under the cards, a line shows the time logged in other time types than the default one, such as overtime or breaks (see Time Types).
Activity charts
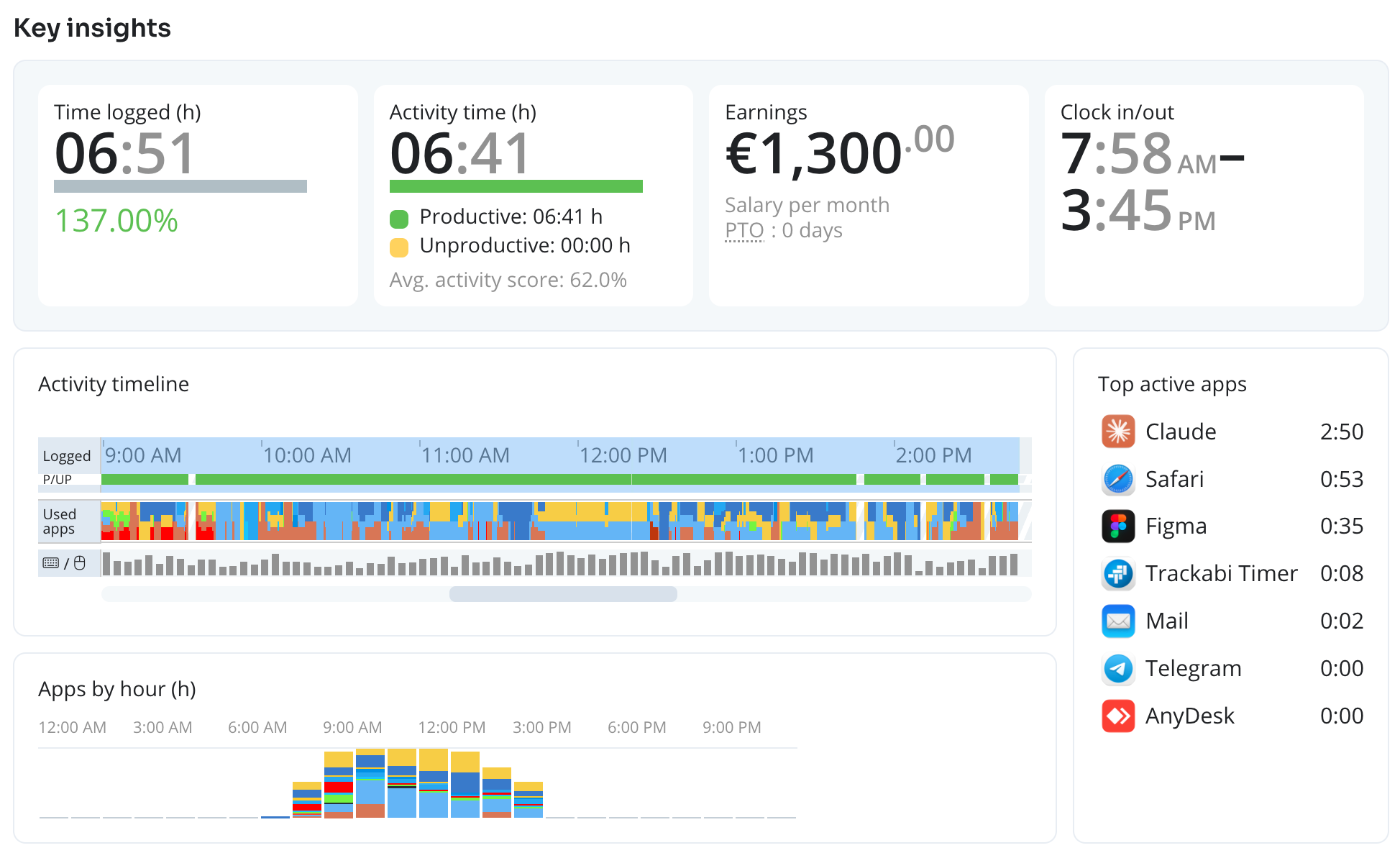
- Day — The Activity timeline of the day and Apps by hour (h). Time added by hand has no computer activity, so it is not drawn on the timeline; a note above it says how much there is.
- Week and Month — Activity by day (h), productive and unproductive time per day. Click a column to open that day.
Top active apps, beside the charts, lists up to 30 applications and websites you used while a timer was running, by time spent.
Work hours
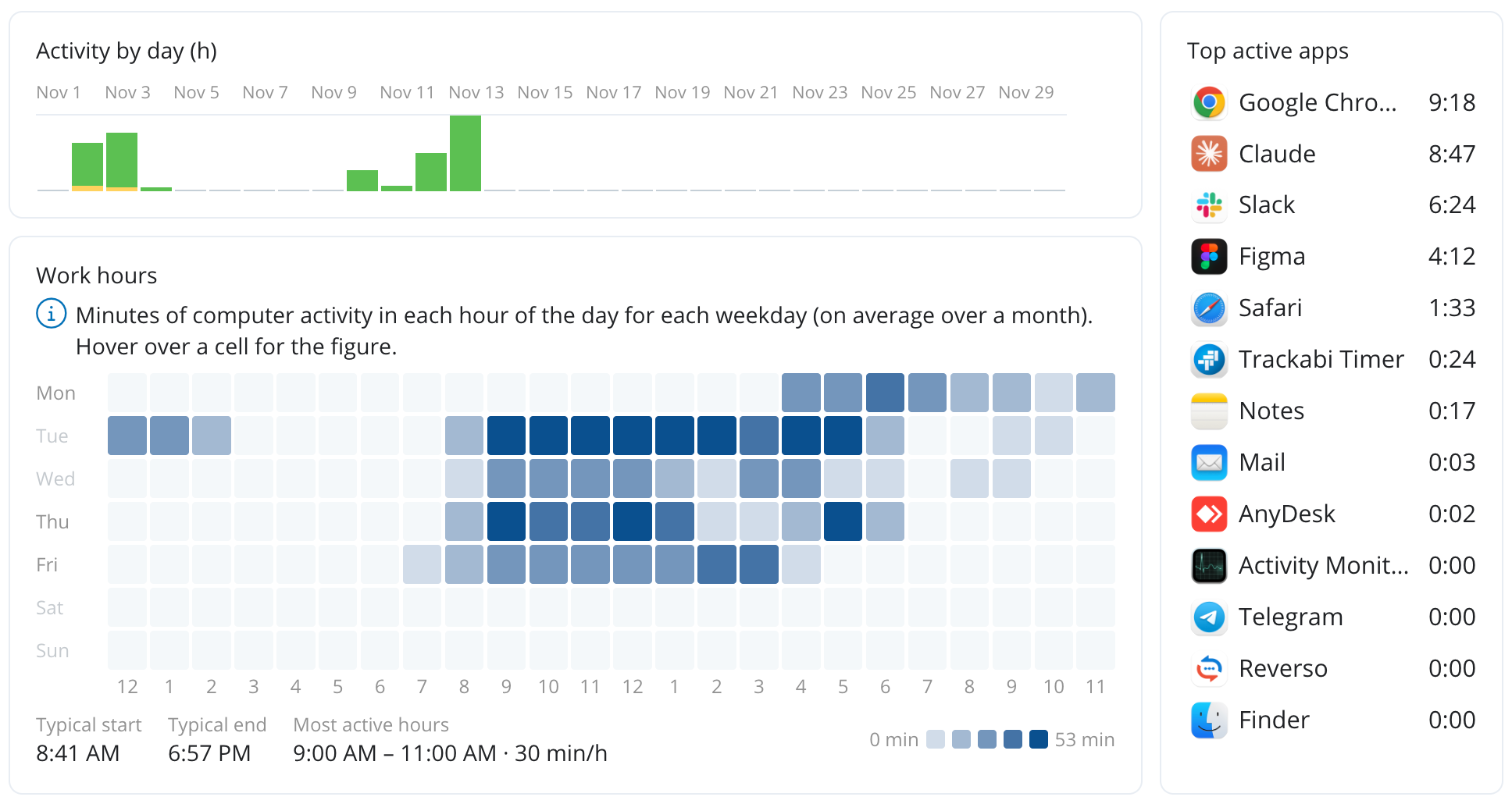
On a week and a month, Work hours is a heatmap of your computer activity: one row per weekday, one column per hour, darker where you were more active. It counts all your computer activity recorded by the desktop app, with or without a timer, so it shows when you actually work rather than when you tracked time. Hover a cell for its minutes of activity; days off in your work schedule have lighter labels, and days still to come are not counted.
Under the heatmap, Typical start and Typical end show when your activity usually begins and ends, and Most active hours the two-hour window with the most activity.
Screenshots
Screenshots shows the screenshots of the period: the whole day, a week grouped by day, or for a month the latest 12 from the last day with activity. The section is shown only when screenshot capturing is on for you, and when the company hides screenshots from users, only to users who can view Insights. See Screenshot Capturing.
Your recent projects and tasks
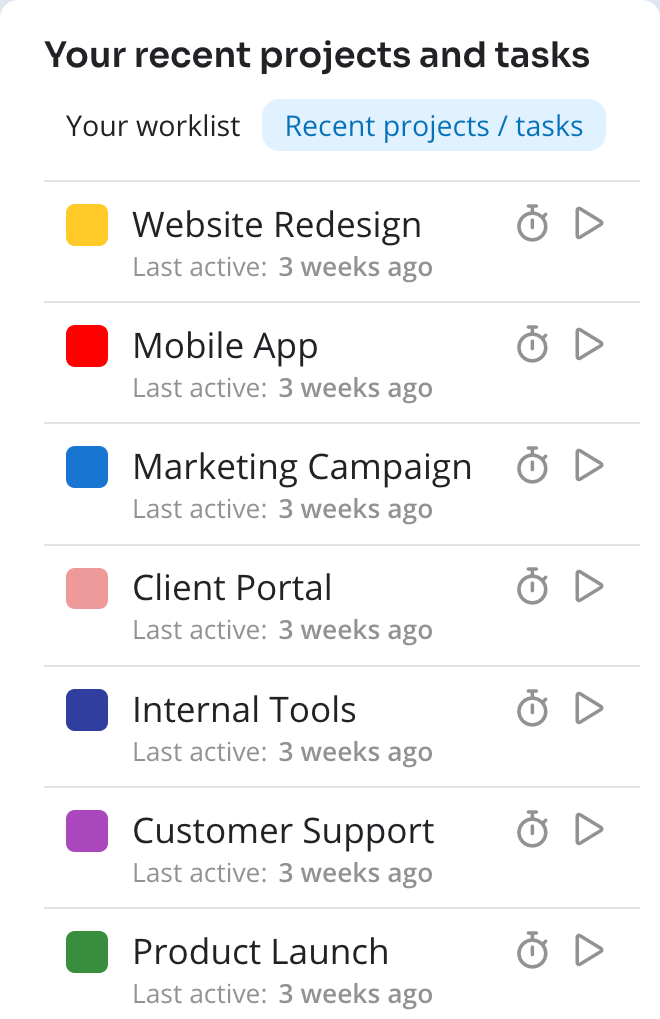
Users who can log time also get a side panel with two tabs:
- Your worklist — Tasks assigned to you whose status is set to appear there, sorted by priority, with a button to start a timer on one.
- Recent projects / tasks — Projects you logged time to or were assigned to in the last 30 days, with a Currently working on entry while your timer runs.
The dashboard needs the dashboard permission of your role. What it shows follows your company's settings: activity data needs the desktop app, and figures from time awaiting approval or rejected are left out of Time logged.