
- Getting Started
- Time Tracking
- Desktop Timer Application
- Work Management
- Time Off & Scheduling
- Reports & Finance
- Administration & Settings
- Integrations
- API
- FAQ
Activity Tracking & Insights
Dernière mise à jour :
Detailed user activity information can be found in the company Insights section. This section provides data crucial for monitoring user performance. It includes details such as logged time, billable hours, user activity duration, user activity scores, screenshots, applications used, URLs opened, and GPS routes.

This article explores all available features and types of data, but please be aware that some features might be disabled in your account settings and the related data might be hidden.
Ensure that users are tracking their time using the Trackabi desktop application. Without it, gathering user activity data is not possible. GPS locations can only be tracked using the Trackabi mobile application.
Insights is not limited to your own staff. A client can be given access to this section for their own projects, which lets people outside your company see the activity data described below — applications used, activity scores and screenshots included. The grant is made per client on the Client Users tab of the client’s page, and is off by default. See Clients.
Choosing a period and a user
Insights shows one Day, Week, Fortnight, or Month at a time. The list on the left starts with a Summary tab and then one tab per user who has data in that period; a user with nothing logged and no activity is not listed. Narrow the list with the Team filter or the name search, and click the sort arrow to flip the alphabetical order. A manager whose permissions are limited to certain teams or projects sees only the users they manage.
Each user tab shows the period's Logged, Billable, and Activity totals, a coloured dot for every time type used, the user's role, and any approved leaves in the period. Three indicators can appear next to the name:
- Red attention icon — The user logged less than their minimum required hours. Hover to see the requirement.
- Notice icon — Suspicious, possibly fraudulent behavior detected. — see Activity Simulators and Suspicious Activity Detection.
- Stopwatch — A timer is running right now.
The Summary tab
The Summary tab adds up the users currently listed, so the Team filter and the search change its figures.
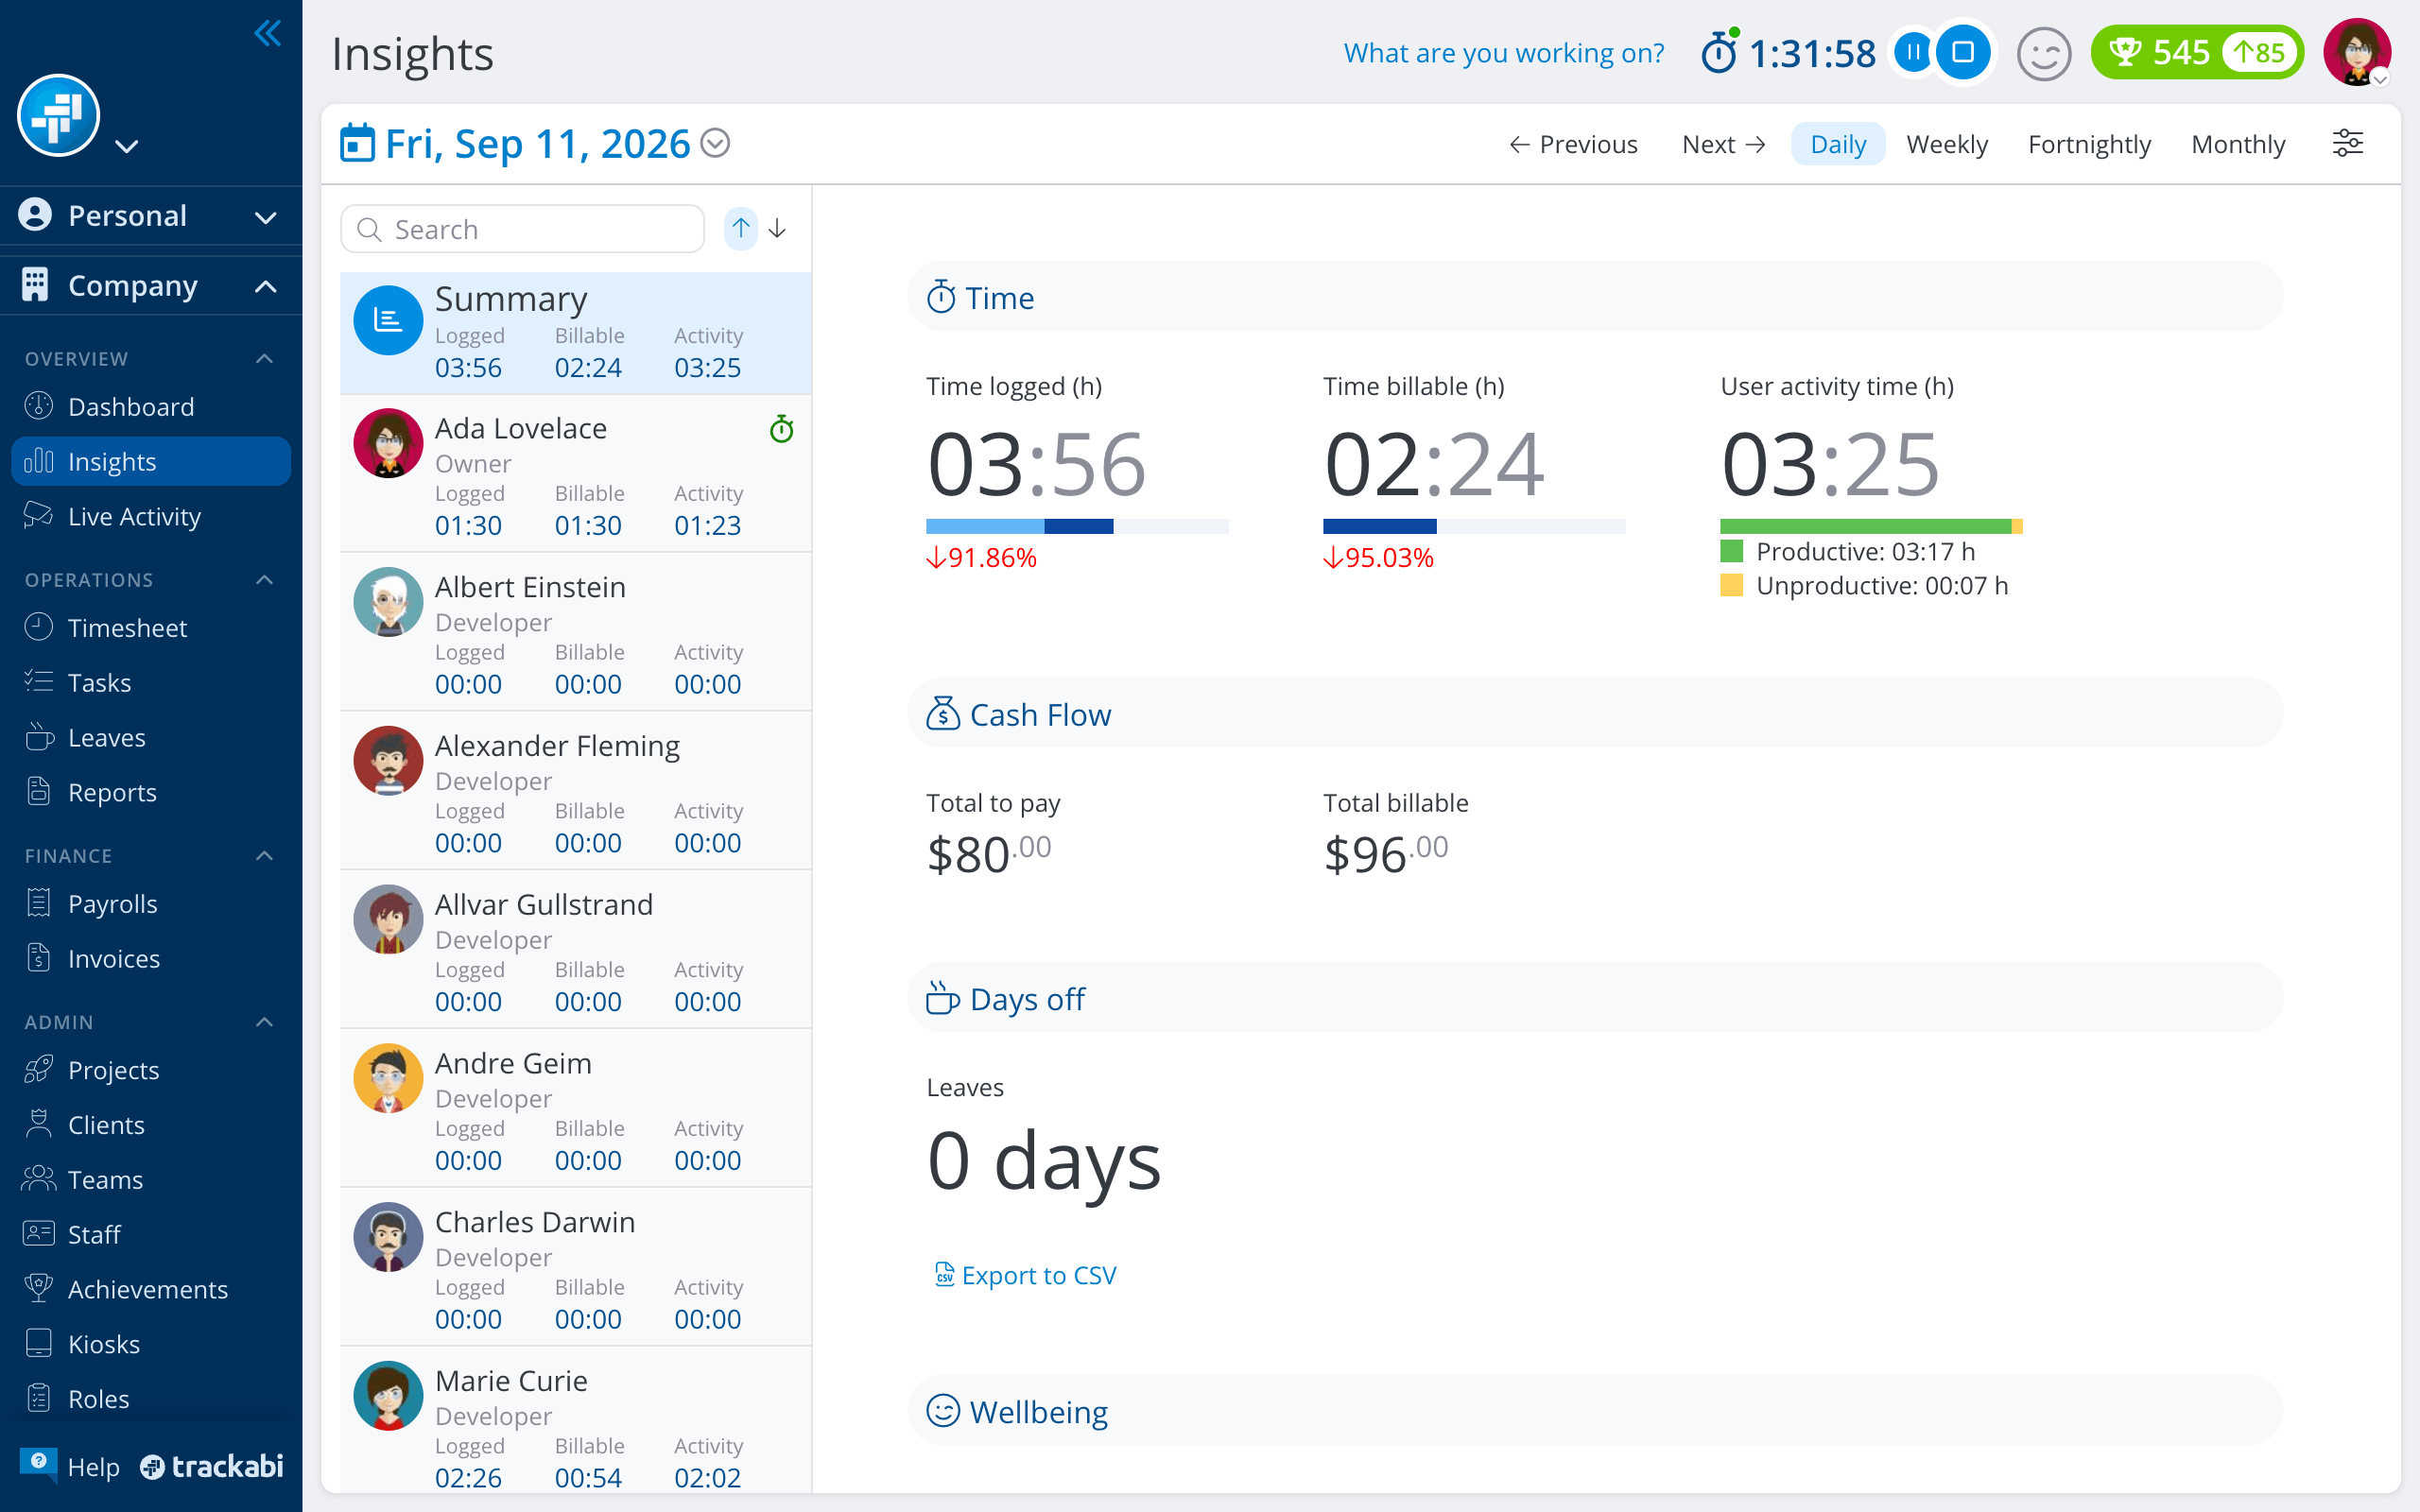
- Time — Time logged, Time billable and User activity time for the period, with the same project bars and comparison percentages as a user's tab, plus the split by time type. Clicking Time logged or Time billable opens the Timesheet filtered to the period.
- Cash Flow — Total to pay — the wages for the logged time plus the cost of paid leave taken in the period — and Total billable, per currency. Total to pay needs the View pay rates and wages permission, Total billable needs View billable rates and amounts; with neither, the block is hidden.
- Days off — Leaves: days of approved leave in the period, split by leave type, with the PTO cost of each type when wages are visible. Public holidays: the days and the holidays that fell in the period, with the work schedule and headcount when the company runs more than one schedule.
- Wellbeing — A radar chart of the company's mood and impact answers for the period. Needs the View wellbeing data permission.
- Export to CSV — Downloads one row per listed user: Member Name, Total logged, Total billable, Productive activity time, Unproductive activity time. Disabled while the period has no data.
Paid time off is already included in Total to pay; the PTO figures under Days off are a breakdown of it, not an extra amount.
Time Logged & Time Billable

Time Logged refers to the total time a user adds to their timesheet, either via a timer or manually. This represents the time the user spends working and should be compensated for. If a wage rate is set, the total amount to be paid is displayed underneath the Time Logged total.
The bar below, usually consisting of several colors, shows the projects the user has worked on and how the time logged is distributed among those projects. Hovering over this bar reveals a tooltip with a list of projects and their respective times.
The first percentage underneath the project bar indicates how the time logged compares to the required amount. If it’s less than 100%, the user worked less than required. The second percentage, shown after an arrow (up or down), represents the difference in time logged compared to the previous period.
Time Billable is the time for which the company should bill its clients. By default, it matches the Time Logged, but it may vary in specific cases. For example, a manager might manually adjust Time Billable in the timesheet section if they believe a task took too long and might not be accepted by the client. Additionally, some projects or tasks may be marked as non-billable, such as administrative work, which is often not directly billable to clients.
Similar to “Time Logged,” under “Time Billable,” you can see the project bar displaying billable projects and, below that, a percentage indicating how the billable time compares to the previous period.
For more information about time logged, time billable, and user activity time, please refer to the Logged, Billable, & User Activity Time article.
Desktop User Activity
The Desktop User Activity tab offers detailed information about when, how much, and on what a user was working during a selected period.
Activity Timeline
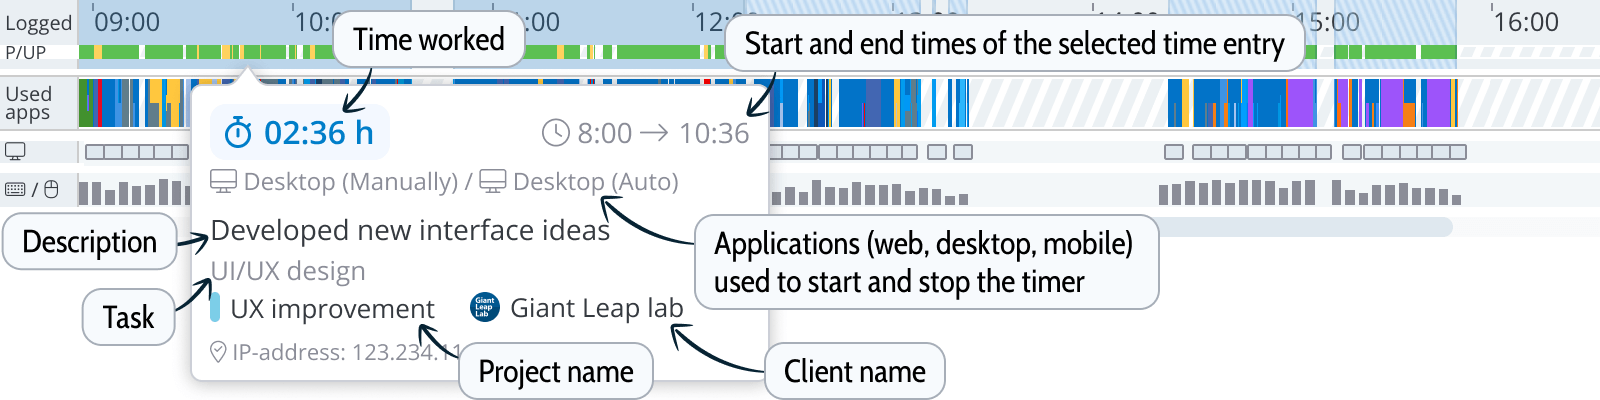
The user activity timeline displays the logged time periods and the associated user activity details.

Hovering over each element provides additional information about it.
The Activity Timeline is available only when viewing by day. It is hidden in weekly and monthly data.
The Time Logged (blue bar) indicates periods recorded as time worked. Hovering over any blue period displays a tooltip with the client, project, and task details, along with the device used (web, desktop, or mobile), and whether time was tracked automatically, manually, or edited. If the timer is currently running, this bar features an animated striped background.
P/U (Productive/Unproductive) bar, with green/yellow colors, shows when productive (green) and unproductive (yellow) applications were used.
You can modify productivity rules and opt to pause the timer or trigger a warning when unproductive applications are used. For more details, read the Tracking Of Productive & Unproductive Time article.
The Used Apps bar displays applications the user interacted with. Each color represents a different app. Hovering over a color reveals the app’s name and the time interval when it was used.
The User Activity Score indicates the intensity of keyboard and mouse usage. It is calculated based on the percentage of time these inputs were active. An average activity score for the current period appears in the Desktop Activity Time section.
The Screenshots bar allows easy navigation through captured screenshots. Clicking on a screenshot icon displays the associated screenshot.
P/U, Used Apps, and User Activity Score are metrics of user activity. However, there may be discrepancies with the time logged if time entries are made manually or if automated time tracking isn’t enabled.
If logged time appears on the timeline, but there is no data in P/U, used apps, or activity score bars, the user may be utilizing a web or mobile timer. You can verify this by hovering over the time logged in the initial bar. To ensure users only use the desktop application, you can disable web and mobile timers and disallow manual time edits in the Roles section.
Time added manually is not drawn on the timeline. When a day contains such entries, a note above the timeline says how many hours were added manually.
Lack of Data and Discrepancies on the Timeline
Occasionally, you may notice that there is no user activity data on the timeline, or the time logged does not correspond to the user activity time. As a result, you may also observe a significant difference between the time logged and user activity time in the summary. Let’s explore why this may happen and how to avoid any issues.
No User Activity Data on the Timeline

If logged time appears on the timeline but there is no data in P/U, used apps, or activity score bars, the user may be utilizing a web or mobile timer or adding the time manually. You can verify this by hovering over the logged time bar. To ensure users only use the desktop application, you can disable web and mobile timers and disallow manual time edits in the Roles section.
Gaps in User Activity on the Timeline

If there are small gaps in the user activity data while there are no pauses in the logged time, this is due to timer tolerance. If there is no activity, the timer may still continue running, waiting for the user to return to work. If the user returns quickly, the timer continues running without a pause. The timer tolerance length is a setting you can adjust in Settings > Time tracking > Auto-tracking.
Rare User Activity on the Timeline

If the logged time is significantly larger than the activity time and you see large portions of missing activity data during the logged periods on the timeline, it's likely that automated time tracking is disabled, and users start and stop their timers at will, regardless of their activity. The related settings can be found in Settings > “Time Tracking” section within the “Desktop Timer settings” block. It is recommended to enable the “Automated Time Tracking” option.
Desktop Activity Time
Desktop Activity Time refers to the duration the user was active on their computer (using the keyboard or mouse). This total time is visible in the second and third bars of the User Activity Timeline. Below the total activity time, productive and unproductive times are compared. Additionally, productive and unproductive time totals, the average activity score, and a breakdown of these times by hour or day are displayed to the right.

Active Apps
The Trackabi Desktop app logs all applications a user opens. When an application window is active, Trackabi tracks the time the app is used. The Top Active Apps block displays the five most frequently used apps. Beside it, a chart shows app usage by the hour or day. Hovering over bars reveals the apps used during that period.

Screenshots
The Trackabi desktop app can capture screenshots while a user is working. These images appear on the timeline and in the Screenshots tab, where they can also be deleted.
Screenshots are available only in the daily view.
Active Windows and URLs
The Active Windows and URLs tab shows the log of all applications that were in use and URLs that were opened. When a user switches to an app and its window becomes active, the app’s window title is recorded. The log also captures main events, such as when the timer starts and stops.
Locations
The Locations tab presents a map with routes recorded by the user while tracking time using the Trackabi mobile application.
Location data is visible only in the daily view.
Wellbeing and karma
A user's header carries a karma badge with the last 30 days' trend and up to three earned achievements — see Gamification Of Time Tracking. If your role has View wellbeing data, the header also shows the user's latest mood, and a Wellbeing tab next to Locations charts their mood over the period — see Wellbeing Analysis.